
10 Best Biopharma Manufacturing Companies Worldwide?
Biopharma manufacturing has become a critical foundation of modern healthcare. Behind every vial, syringe, and refrigerated shipment stands a complex network of science, engineering, and quality control. This guide explores 10 Best Biopharma Manufacturing Companies Worldwide, focusing on organizations that support biologics, vaccines, cell therapies, and other advanced medicines.
The comparison considers manufacturing scale, regulatory performance, technological capability, and supply reliability. It also examines sterile fill-finish operations, single-use systems, analytical development, and cold-chain management. These details matter when a product must remain stable from a controlled cleanroom to a hospital pharmacy. Strong companies usually maintain validated processes, trained personnel, transparent documentation, and resilient supplier networks. Their facilities may look different, but disciplined execution remains essential.
No ranking is flawless. Company performance can change after acquisitions, inspections, capacity expansions, or unexpected supply disruptions. That limitation matters. Public information may also show reputation more clearly than everyday operational problems. Therefore, the selection should be viewed as a practical industry guide, not a permanent verdict. Readers should review current regulatory records, service capabilities, geographic coverage, and therapeutic expertise before making business decisions. The strongest manufacturers are not defined by size alone. They earn trust through consistent batches, clear communication, measurable quality systems, and responsible partnerships. Small details matter. A missed temperature excursion, delayed deviation review, or unclear tech-transfer document can affect an entire program. This article highlights the companies best positioned to manage those pressures while acknowledging the challenges that remain.
Defining the Top 10: GMP Compliance, Revenue, Capacity, and Global Reach
10 Best Biopharma Manufacturing Companies Worldwide?
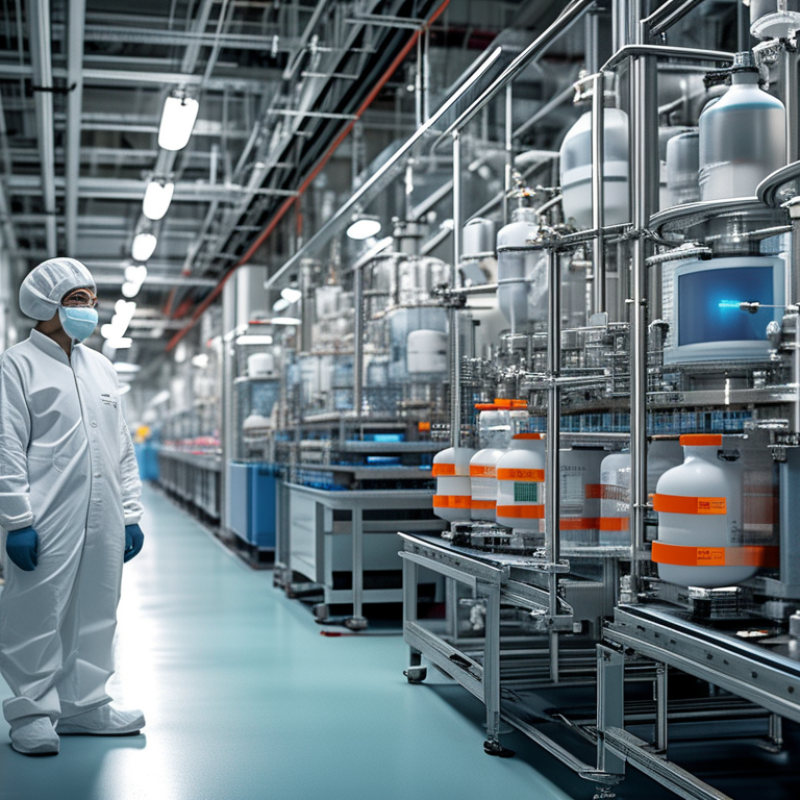
Defining the top 10 requires more than counting facilities or annual sales. GMP compliance is the gatekeeper. Strong manufacturers maintain validated processes, controlled cleanrooms, trained operators, and complete electronic batch records. They investigate deviations instead of hiding them. Recent inspection outcomes, data integrity, and corrective-action quality often reveal more than polished websites. In practice, a clean audit trail can matter more than impressive corporate language.
Revenue provides useful evidence, but it cannot stand alone. A large turnover may reflect licensing income rather than manufacturing strength. Capacity should be measured through usable production lines, fill-finish capability, and reliable technology transfer. A facility producing sterile medicines needs precise environmental monitoring and disciplined cold-chain control. Small failures can disrupt supply for months. Capacity on paper is not capacity under pressure.
Global reach also deserves careful testing. Leading manufacturers usually operate across several regulated regions, with qualified sites and resilient supplier networks. They understand local submission expectations and maintain consistent quality between locations. However, rankings remain imperfect. Public data can be incomplete, delayed, or shaped by marketing priorities. A credible assessment should compare audited performance, revenue quality, production capacity, delivery history, and technical expertise. The best candidates are not simply the largest. They are dependable when processes become complicated.
10 Best Biopharma Manufacturing Companies Worldwide? - Defining the Top 10: GMP Compliance, Revenue, Capacity, and Global Reach
An anonymized comparison of leading biopharmaceutical manufacturing organizations using publicly reported scale indicators and a composite assessment of compliance, capacity, and international reach.
| Rank | Anonymized Manufacturer | FY2023 Reported Revenue (Approx. USD) |
Manufacturing Sites (Approx.) |
Countries with Manufacturing Operations |
Large-Scale Biologics Capacity | GMP Compliance and Regulatory Reach | Primary Manufacturing Capabilities | Commercial and Client Reach | Composite Score / 100 |
|---|---|---|---|---|---|---|---|---|---|
| 1 | Manufacturer A | Approximately $42.9 billion group revenue; biopharma manufacturing is reported within a broader life-sciences portfolio. | More than 60 | 20+ | Very high Multiple commercial-scale biologics and sterile manufacturing networks. |
FDA, EMA and other major-market GMP systems Extensive inspection and validation infrastructure. |
Biologics, vaccines, sterile injectables, cell and gene therapy services, clinical supply, analytical services. | Global operations supporting small biotechnology companies and multinational pharmaceutical groups. | 96 |
| 2 | Manufacturer B | Approximately $7–8 billion equivalent group revenue, with a substantial contract-development and manufacturing business. | 30+ | 10+ | Very high Large mammalian-cell, microbial, viral-vector and drug-product capacity. |
Broad global GMP coverage Facilities are routinely used for regulated commercial supply. |
Mammalian biologics, microbial fermentation, antibody-drug conjugates, APIs, drug product, cell and gene therapy. | Strong presence across North America, Europe and Asia with global technology-transfer capabilities. | 95 |
| 3 | Manufacturer C | Approximately $3.7 billion equivalent group revenue, primarily associated with large-scale biologics manufacturing and services. | 10+ | 5+ | Very high More than 600,000 liters of mammalian-cell bioreactor capacity reported across major facilities. |
FDA, EMA and other leading authority approvals Strong commercial-scale inspection record. |
Monoclonal antibodies, recombinant proteins, drug substance, aseptic fill-finish and biosimilar manufacturing. | International client base with particularly strong Asia-Pacific and North American expansion. | 94 |
| 4 | Manufacturer D | Approximately $2.5 billion group revenue reported for the biopharma-focused business. | 20+ | 5+ | Very high More than 250,000 liters of reported bioreactor capacity, including commercial-scale facilities. |
Major-market GMP authorizations Integrated quality systems from cell-line development through commercial production. |
Antibodies, recombinant proteins, vaccines, cell and gene therapy, conjugates and drug product. | Broad global client base and integrated research, development and manufacturing network. | 93 |
| 5 | Manufacturer E | Approximately $4.3 billion group revenue; contract manufacturing represents a major operating segment. | 50+ | 15+ | High Large-scale biologics, oral-dose, sterile and clinical-to-commercial manufacturing capacity. |
Extensive FDA and European GMP footprint Multiple facilities support approved products and late-stage programs. |
Biologics, oral solids, sterile injectables, inhalation products, gene therapy and clinical supply. | One of the widest global networks for integrated development, manufacturing and packaging services. | 91 |
| 6 | Manufacturer F | Approximately $1.5–2.0 billion equivalent life-sciences manufacturing revenue reported across global operations. | 15+ | 5+ | High Commercial-scale mammalian-cell and microbial capacity with expanding advanced-therapy assets. |
FDA, EMA and other regulated-market compliance Strong process-development and technology-transfer controls. |
Monoclonal antibodies, recombinant proteins, vaccines, viral vectors, cell therapy and aseptic drug product. | Global network spanning the United States, Europe and Asia with strong development support. | 89 |
| 7 | Manufacturer G | Contract manufacturing revenue is not separately disclosed; parent-company revenue is reported in the multi-billion-dollar range. | 10+ | 5+ | High Commercial biologics, vaccines and pharmaceutical product capacity across several regions. |
Long-standing global GMP experience Facilities support highly regulated commercial products. |
Biologics, vaccines, mammalian-cell culture, microbial processes, fill-finish and pharmaceutical APIs. | Established multinational presence with strong European, North American and Asian coverage. | 88 |
| 8 | Manufacturer H | Approximately $1.3–1.6 billion equivalent group revenue, with a significant specialty-manufacturing component. | 10+ | 5+ | Medium to high Specialized commercial-scale capacity with strong small- and mid-volume flexibility. |
FDA, EMA and Swiss-style quality systems Strong reputation in highly regulated specialty products. |
Small molecules, peptides, oligonucleotides, high-potency APIs, sterile products and selected biologics. | International network focused on complex products and long-term pharmaceutical partnerships. | 86 |
| 9 | Manufacturer I | Approximately $1.0–1.3 billion equivalent group revenue; manufacturing revenue is not always reported separately by modality. | 15+ | 10+ | Medium to high Distributed capacity for clinical, launch and commercial pharmaceutical supply. |
Multi-region GMP network Supports regulated-market development, production and packaging programs. |
Small molecules, biologics, sterile injectables, oral solids, packaging and supply-chain services. | Broad European footprint with additional North American and international delivery capabilities. | 84 |
| 10 | Manufacturer J | Contract-development and manufacturing revenue is not separately disclosed; parent-company revenue is reported in the multi-billion-dollar range. | 10+ | 5+ | Medium to high Integrated biologics and advanced-therapy capacity with ongoing network expansion. |
Major-market GMP capability Quality systems cover early development through commercial manufacturing. |
Mammalian biologics, microbial products, viral vectors, cell therapy, plasmids and drug product. | International operations serving emerging biotechnology companies and global pharmaceutical customers. | 82 |
Related Posts
-

Top 10 Trends Shaping Biopharma Manufacturing Today?
-
10 Essential Tips for Optimizing Biopharma Production Efficiency?
-

Top 10 Biopharma Manufacturing Best Practices for 2026?
-

2026 Best Biopharma Production Techniques and Innovations to Watch?
-
Top 5 Best Oligo Synthesizers for Precision DNA Synthesis Techniques?
-

Top 10 Peptide Synthesizers for Efficient Research Needs?